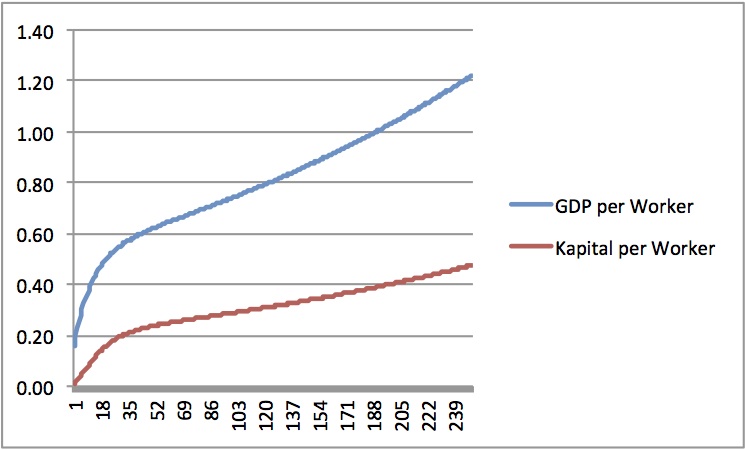
According to the Solow Growth model, if we start with L=1 and K=1 in year1, we can get a picture of GDP per worker and capital per worker in 100 years.

Assumptions and sensitivity analyses with regard to α, n and s are shown below:

======= addenda by the prof – I can’t figure out how to put a graph in a comment. Here’s what happens as soon as you put in productivity growth, here at 0.2% per period.

2 Comments
So growth ends, more rather than less, within 20 years – capital accumulates quickly.
right, showing diminishing returns
Comments are closed.