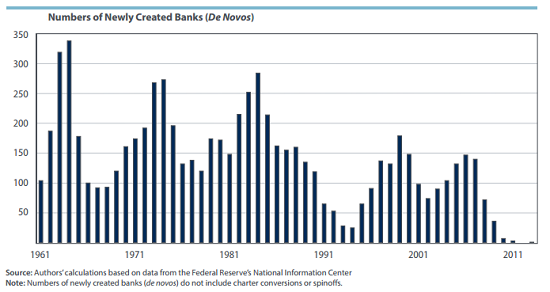
Currently, new US banks are being created at the slowest pace in 50 years, which likely could reduce availability of credit to small businesses. Since 1990, the average rate of new bank formation was about 100 per year. However, since 2010, this rate has slipped to approximately 3 per year, as you can see from the graph below from the Richmond Fed. The last time it was even close to this low was in 1994, but it was still well above the 3 per year rate. Most banks start small, so this decline in new bank formation must decrease the number of local and community banks. These types of banks often lend to small businesses, so their decline could certainly affect the distribution of credit to small and local businesses. This low formation rate could be due to low interest rates, which make it more difficult for banks to turn a profit. If this is actually the cause, then new bank formation should increase as the economy improves and the Fed raises rates again.
3 Comments
The other period of low bank formation in the early 90’s also seemed to trail a recession.
Another explanation for the low bank formation could be the increased regulatory measures since the recession. Perhaps these regulations are making it more difficult for new banks to form, or at least making it less worthwhile. If this is the case, we may see bank regulations loosen slightly.
A priori there is no particular reason to view the level of new bank creations as either good or bad. To make that judgement requires many additional types of data and a theory of what is ideal. For example, the surge in new bank creations in the 2000s may have reflected varying levels of strictness in issuing banking licenses at the state level in combination with the perception of opportunities during the growth of the housing bubble. The state of Georgia led the country in new banks, and then led the country in bank failures. So the lower rate of bank formation may be a good thing.
More generally, what we might want is a density of branches commensurate with local economic activity and population for consumer banking services, which is a very different metric than the number of banks. One bank may provide good coverage for an entire region, thanks to a large number of branches. For small businesses, we might want the number of loan officers relative to economic activity, and such loan officers may work out of an office that does not handle “retail” transactions, that is, is not a bank branch. Locally BB&T has an office building that houses a number of such specialist bankers who cover a wide geographic area and that is separate from any branch. This also means that competition, the ability of a small business to approach several institutions as potential lenders, does not line up neatly with the number of “banks.”
So what has happened in bank consolidation and bank exit, and not just bank formation? What has happened to the total number of bank branches? How has the number of different banks with branches within (say) 2 miles of the average American changed over time? What of loan officers? — are they more or less numerous? more specialized while covering a wider geography (not all small businesses are alike)?
Comments are closed.