The Producer Price Index (PPI) is an index released monthly by the Bureau of Labor Statistics (BLS). To put it in simple words, PPI measures price changes from the perspective of the sellers, as opposed to the Consumer Price Index (CPI), which measures price changes from the purchasers’ perspective.
One of the reasons that PPI is so valuable is because of its inherent ability to predict CPI as an indicator of inflation. The Fed makes use of the PPI data to prepare for future counter-inflation policies and investors can look in advance of the market and make business plans accordingly.
 From the graph we can see that the percent changes from the previous year’s PPI fluctuate a lot but for the past few decades, the change is mostly positive. Note that PPI does not represent prices at the consumer level. PPI calculations use a benchmark year (1982) where the basket of goods (a weighted fixed set of consumer products and services in 1982) was measured with an index of 100.
Note that BLS states that since some PPIs such as the ones for food and energy goods, as well as wholesale and retail trade are more volatile than other goods in short-term, PPI calculates a number of indexes excluding prices for these components separately. In addition, an index for final demand less food, energy, and trade services is calculated as well. The weighting for different industries is updated once every five years. This is potentially problematic as PPI might not be able to reflect its proportion to real GDP very well.
Sources:
https://research.stlouisfed.org/fred2/series/PPIACO
http://www.bls.gov/ppi/ppifaq.htm#16
Graphs added in association with comments
 |
 |
 |
 |
7 Comments
Thanks, Jerry / Jier!
1. How closely does “the” CPI inflation rate track the PPI? Does this predict future CPI changes and hence help the Fed decide when to change policy? Or is it primarily useful to businesses to help them understand whether the price changes they see are part of a pattern?
2. What are the strengths and weaknesses of creating an index against a base year, using base year weights? Think too of the technical challenges of collecting data and setting up the index – choosing what to include, what weight to use, and from what firms to collect monthly prices.
3. OK, go to FRED and check: look at the PPI excluding food and energy. How does it compare to the full index? To save you time here are four codes to type into FRED. You can put them all in the same graph using Graph > Add Series staying with the default add new series. Play around & think! – narrow the time period? Show the graph as the index level or the year-over-year percentage increase or the current month-over-month percentage increase?
a: PPIACO everything, the “headline” series
b: PPILFE less food energy
c: PPIIFF intermediate foods feeds
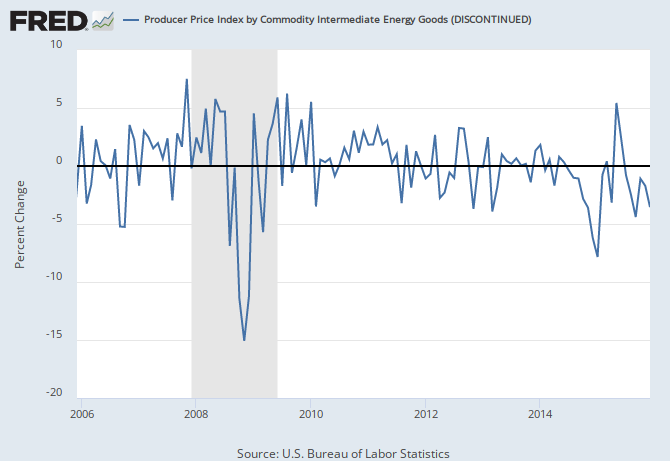
d: PPIIEG intermediate energy goods
The PPI does often parallel movements from the CPI (or rather anticipates them), but when the moves differ it can create some confusion by showing different movements in prices. CPI is primarily related to cost of living while PPI deflates revenue streams to measure the growth in output, which can lead to differences in their movements. According to the Bureau of Labor Statistics, the PPI only covers 72% of services while CPI has complete coverage of services. In addition, goods are also categorized differently in each index, with some utilities being labeled as goods under PPI and services under CPI. Finally, formulas in each use weights that are updated at different intervals. These differences all contribute to the discrepancies in movement between the indexes.
The PPI includes intermediate goods. Conceptually does that matter? If so, in what circumstances?
Unfortunately I don’t think you can get graphs to display in comments. I will play with that, whether there is a workaround.
Including intermediate goods should matter if the goal of the analysis is to use PPI to predict CPI. A typical consumer would not buy intermediate goods, so their inclusion may alter the relationship. FRED has another PPI data set for finished goods only. Perhaps that one is better for predictions.
https://research.stlouisfed.org/fred2/graph/fredgraph.png?g=1S1R
This first graph shows all (A,B,C,D) against each other from 1974 to 2015. It shows PPILFE less food energy increasing gradually overtime at a much steadier pace than the other 3 lines, but it still shows some similar movements (Increases and decreases as the other graphs move) just not to the same degree of change. I moved the time line to show the range from 2000-2015. After doing this I noticed similar trends. From 2000 to about 2001 all indices are increasing then decrease as a recession hit. The PPILFE less food energy somewhat plateaus as the other graphs show a sharp decrease. The same occurs for the recession that hit in 2008
https://research.stlouisfed.org/fred2/graph/fredgraph.png?g=1S2L
This next graph is the percentage change from a year ago for all these lines. This yields similar results. The lines all show similar trends increasing and decreasing at the same times.
https://research.stlouisfed.org/fred2/graph/fredgraph.png?g=1S31
This last graph shows the percentage change monthly. To be honest I found this graph a little hard to read as the lines cross over each other so frequently, but if you narrow the time frame down enough it shows similar trends that I mentioned before.
So (i) inflation as measured by the PPI is, well, a general measure: if all prices are moving up, over a longish time period so do indices that include food and energy.
But (ii) if we look at energy alone, does that help predict future PPI inflation? — ditto food.
A third issue (iii): how do you handle things when data show a lot of volatility, typical with a monthly frequency, then how can you extract information? [Monthly volatility can reflect measurement error, as accumulated over time the sample size is effectively larger. At the monthly level you also pick up the effect of holidays, months with 5 Saturdays, bad weather (and great weather!), and so on.]
Due to the sensitive/volatile nature of the prices of food and energy, I think they are still useful in many circumstances to predict the overall price level. Economists may use the volatile prices as a sign of future overall price increases. Increase in aggregate demand that might lead to higher inflation may initially be repesented by increases in sensitive prices that are set in more competitive markets. If these prices are not put into considerations just because their volatile nature, these signals of inflation may be missed.
Comments are closed.