Despite falling prices for oil in the global market, oil production in the United States has increased in the past year. The main reason for this increase is due to fracturing shale formations in recent years.

As of 2014, the United States was the 3rd largest producer of crude oil worldwide. In terms of the sources of crude oil, in the past 10 years there has been a spike in tight oil production. Tight oil refers to oil that must be extracted by the process of fracturing, as opposed to conventional drilling. Of all the tight oil resources, shale oil is the most plentiful in the United States.
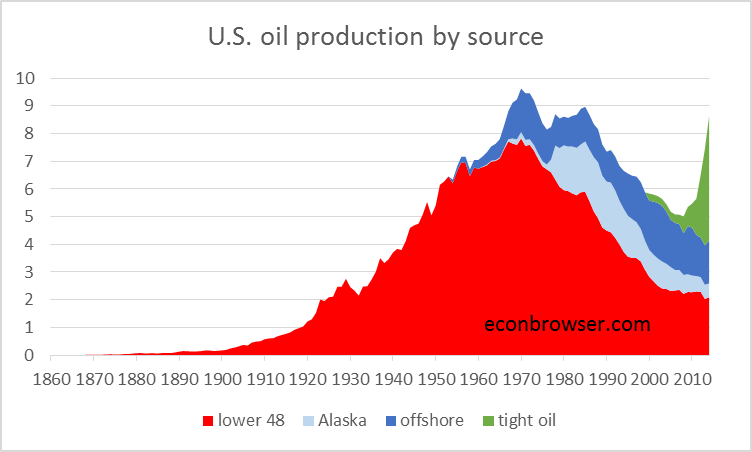
In the last year, of the roughly 8.5 million barrels of crude oil that the United States produced each day, over 4 million barrels (or 50% of all domestic crude oil) can be attributed to these ‘tight oil’ resources.
The most interesting part of this oil story comes when looking at the global impact of the increase in domestic shale oil production. As shown below, the amount of global crude oil production has been steadily increasing.
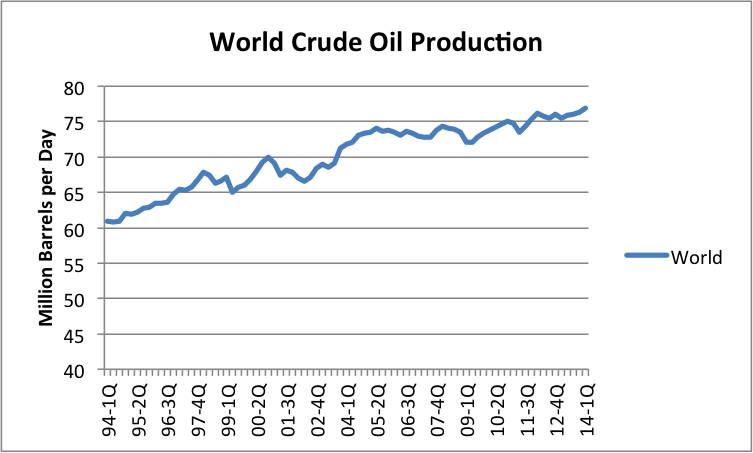
Source:https://gailtheactuary.files.wordpress.com/2014/07/world-crude-oil-production-quarterly.png
However, when looking at the global crude oil production excluding the United States, there is a very different picture. It is clear that there has been a plateau in the global (excluding the United States) crude oil production for the past 10 years. The chart showing the crude oil production in the United States, shows that if tight oil were to be excluded, the United States’ oil production has actually been declining for the past 10 years. This shows the significant impact shale oil has had on domestic crude oil production as well as the impact that domestic shale oil has had on the global oil market.

Source:https://gailtheactuary.files.wordpress.com/2014/07/world-oil-supply-excluding-united-states.png
http://www.eia.gov/petroleum/drilling/#tabs-summary-2
http://www.eia.gov/todayinenergy/detail.cfm?id=16931
http://www.eia.gov/forecasts/aeo/er/executive_summary.cfm
One Comment
It’s interesting to note the divergence of drilling [falling rapidly] and output [still rising]. That’s an important lesson in diminishing returns, the wells that are still being drilled are big producers. It also makes it hard to foresee the cycle, whether / how much output will fall in the face of low prices.
Now one component may be a fixed-versus-variable cost distinction: Wells already drilled represent sunk costs [pun not accidental], while the variable costs of production are likely quite low. On the other hand, sunk costs are matched by soaring debt, that is, firms need cash flow, that is, they want to keep the oil flowing. It may not be an option to leave oil in the ground, once a well has been drilled and some has flowed (or been pushed) out; I don’t know the geology. But if you are getting only 2% on a 10-year bond, leaving it in the ground seems sensible, oil prices won’t stay depressed more than a few years, and the return on oil in the ground ought to beat taking the revenue and putting it in the bank. Oh, wait, the banks are lined up, lawyers on hand, asking for their money or else … chapter 11, here we come.
Comments are closed.