Wednesday’s release of the Consumer Price Index (seasonally adjusted for All Urban Consumers) revealed inflation of .3% in December of 2016, leaving annual 2016 inflation at 2.1% before seasonal adjustment. This data release signals year over year price growth not seen since 2013 and a significant increase from the meager .7% inflation in 2015.
It is essential when interpreting the CPI to understand the portfolio that the index represents, and how subjective inclusion of different goods can affect the perceived signal. The 2015 reweighting of CPI components lists Housing at 42%, Transportation at 15%, and Food and Beverages at 15% of the index composition. The remaining 28% is composed of education and communication, recreation, medical care, and apparel. However, although food/beverages and transportation amount to 30% of the CPI portfolio, large potions of those subcategories are stripped from the data in order to exclude volatile energy and grain prices. This “core inflation” is named CPI For All Urban Consumers (Less Food and Energy), and is the version predominantly used by the Fed and other market actors in order to measure standardized price growth over time (although other indices not published by the Bureau of Labor Statistics are often favored).
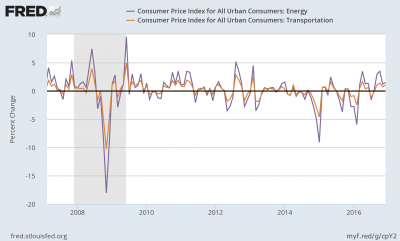
Stripping out data from volatile external markets may provide a long-run inflation signal, but the exclusion of energy and food data will undoubtedly blur our short-run vision. Regarding Figure 1, we can observe that core inflation has remained between 3% and approximately 0.7% year over year since mid-2006 with a slow and steady decline through the recession, while total CPI has ranged from above 5.5% all the way down to -2% year over year. Looking at Figure 2, you can see the index separation between total and core inflation beginning in late-2014, showing the impact of energy price collapses across domestic prices. Although energy itself is not a subcategory of the CPI, energy consumption prices are included slightly in housing (gas, power utilities, etc.), but energy makes up a considerable and volatile portion of the transportation subcategory. Viewing Figure 3, notice the total index prices of energy and transportation, and how volatility in energy markets heavily impacts transportation costs (keep in mind, this is 15% of the CPI). Figure 4 shows the monthly percent changes in energy and transportation prices and gives light to the volatility caused by external markets. It should be noted that the prices of cars, tires, maintenance, and other non-energy factors keep these two indices from total correlation.
Although core inflation provides a steady observation of general price growth in the United States, the visualization of volatility in the transportation subcategory is enough to understand that short-run inflation should not be analyzed purely by the prices of clothes, movie tickets, and Benadryl. Although FED members and economists have labeled energy market volatility as purely transitory, that volatility has significant impacts in the prices of overall consumption in the United States.
Figure 1.
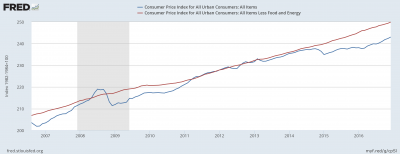
Figure 2.
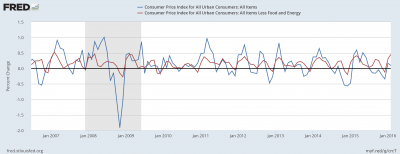
Figure 3.
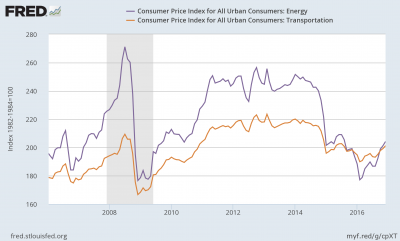
Figure 4.
7 Comments
I agree with your point that adding energy back into the graph adds more volatility as that’s what I saw when I did the long-term analysis too. However, you bring up a good point that energy volatility does have real impacts for consumers even though it’s not included in the “core CPI.” So I wonder whether the core CPI is a good indicator of what people are actually spending? I remember in macro econ learning about the basket of “goods”, and that’s how we determine average costs for a household – but I wonder if there are different techniques that are more accurate? The pov classes I took come into mind of how we’re not just looking at money and income but also capabilities – while this would be difficult to measure, I wonder what alternate methods there may or may not be.
The “headline” CPI includes food and energy. You can also dive into the data to construct an index appropriate for your personal circumstances. The BLS now has an experimental index for those age 62 and above. And so on.
It seems like core inflation is definitely effective at doing its job (providing a steadier measure of consumption without consideration of highly volatile goods like energy). This has been especially important in recent years, considering the precipitous drop of crude oil prices between 2014 and 2015. It would be difficult to accurately compare consumption today, with consumption 5 years ago, if core inflation had not been considered. However, if core inflation is meant to ignore the effects of energy prices on consumption, it by no means encompasses all of them. Take crude oil for example. The price of crude oil has an effect on many areas besides gasoline and home utilities. Tourism and travel will be effected due to changes in jet fuel prices. A massive amount of items we use on a daily basis, require petroleum to be made. Any plastic item, as well as electronics, tires, asphalt, ink, paint, shoe polish, nylon, roof shingles, cosmetics, candles, vaseline, pesticide, bug spray, ammonia, paper, wax, and virtually any item you can imagine, requires crude oil for production in some capacity. The point is that subtracting energy consumption does not begin to cover the total effect of volatile energy prices on the economy. To me, for the purpose of judging short term trends, it seems more logical to examine total inflation.
I agree with you, energy comprises far too much of our daily consumption to go ignored. However, energy prices and other volatile components of the CPI prevent it from effectively showing the true change in prices for most market goods and services. We should take into account both energy prices and the strength of the dollar relative to other currencies when assessing the CPI, which the core CPI does a decent job of doing (at least it adjusts for energy). When energy prices are low, consumers have more disposable income for other items and therefore, the CPI likely underestimates the true inflation rate. Likewise, a strong dollar holds down the prices of imported goods, and therefore also can cause the CPI to potentially understate inflation. All in all, though the core CPI is far from a perfect measure of inflation, it adjusts for at least some of the factors that push the normal CPI away from true change in price level of all goods and services in an economy.
From a monetary policy perspective, a change in interest rates won’t necessarily affect food prices (we can’t control the weather) or energy (global considerations are a very large factor). Second, do food and energy feed into inflation? If we run a regression on lagged volatile components, do we get significant coefficients? If not, then that’s another reason to focus on “core” items.
The BLS (or various Feds) also published “trimmed mean” [inflation excluding items that are at the right and left tails of the distribution of price changes] and “sticky” vs “flexible” price inflation indices [an extension of the “core” idea].
I wonder if the CPI has had any major changes in the basket of goods due to globalization. When thinking of things that factor into the CPI it would make the most sense to have domestically produced items to accurately look at the costs of production as well, but as cheaper goods come in from countries like China the same basket of goods would look very different depending not eh country of origin. This only really matters for things like food, beverages, apparel, and recreation but adding all of that together makes up a considerable portion of the CPI.
What do we consume today that we didn’t in (say) 2002? Some items are altogether new (iPads, smart phones) and likely clothing and shoe prices have fallen, globalization wasn’t (quite) fully realized in those sectors. Overall, however, the share of goods has fallen (and hence the tradables component). We don’t “consume” globalization directly, and other than call centers few of the services we consume are directly imported – and since we don’t pay for call centers, that doesn’t show up in the CPI.
Comments are closed.