
According to the most recent news release from the Bureau of Economic Analysis, Real GDP decreased 0.1% in the fourth quarter of 2012, but increased 2.2% for the full year after increasing 1.8% in 2011. The pickup in economic growth for the full year 2012 mainly reflected a slowdown in imports, notably in capital goods (except autos) and consumer goods, a rebound in residential housing, an upturn in inventory investment and a smaller decrease in state and local government spending. The news release ascribes the acceleration in real GDP in 2012 to “a deceleration in imports, upturns in residential fixed investment and in private inventory investment, and smaller decreases in state and local government spending and in federal government spending that were partly offset by decelerations in PCE, exports, and non-residential fixed investment.”
While the Current Employment Statistics Highlights from the Bureau of Labor Statistics reported a rise in employment across construction, non-farm, wholesale trade, retail trade, healthcare and mining industries, the unemployment situation is not getting much better. Household data from the Current Population Survey shows the number of people not in the labor force has increased by 2,000,000 since 2011 and has been increasing steadily since 2008.
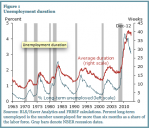
The San Francisco Fed’s Rob Valletta discusses the unemployment situation in his article “Long-term Unemployment: What Do We Know?” Valletta points out that while the unemployment rate has fallen since 2009, “the average duration of unemployment rose from about 28 weeks to a peak of nearly 41 weeks in late 2011” and since then has dropped only slightly to 38 weeks, reflected in the graph below: Figure 2 in the article reflects younger workers’ “disproportionately high rates of both long-term and short-term unemployment” and comments on the long-term unemployment situation for individuals previously employed in the manufacturing or financial industries: “Older workers, blacks, and individuals whose previous jobs were in the manufacturing or the financial sector have disproportionately higher rates of long-term unemployment compared with short-term unemployment.”
I have compiled data from the BLS, visible in the two thumbnails at the beginning of the post, that reflect Valletta’s argument that the employment situation is not improving as much as people may believe. The number of people not in labor force has increased by almost 10,000,000 since 2008 reflected in the labor force participation rate graph below, which could explain why the unemployment rate has been decreasing. Similarly the number of people not in the labor force but who currently want a job has increased by 700,000 since 4th quarter 2009. As you can see in the annual data while Real GDP data shows signs of economic improvement since 2008, the employment situation tells a different story.

One Comment
In examining Figure 1 on the duration of unemployment: What could be the causes of the lengthening of long-term unemployment? What role could the current unemployment benefit programs play in the problem?
Given the most recent discouraging unemployment figures released at the beginning of April, what could government do to encourage people to get back to work? Should the government play any role at all in creating jobs, or is this a recession that the country must suffer through and learn from?
Nobody likes the idea of regulations in a struggling economy, but when you ride bubble after bubble (see .com boom, housing) it is important that the government takes the necessary steps to keep this from happening again at such a large scale.
Comments are closed.