Long-run CPI trend
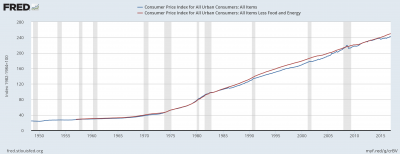
Figure 1: CPI for all items and all items less food and energy
This graph shows the long-run CPI trends since the 1950’s. Specifically, after 1955, when the reorientation of the economy following WWII was complete. There seems to be a steadily rising trend throughout the years as observed in the graph (See Figure 1). However, if you narrow the scope of the graph, you can see that there was a great deal of variation between and within years. It is important to keep that in mind though the long-term trend seems to be smooth up-wards trend.
The CPI is a “measure of the average change over time in the prices paid by urban consumers for a market basket of consumer goods and services” (bls.gov), so it makes sense that the CPI would continue to increase as time goes on because the price of the goods and services that people tend to buy also increases – especially if we’re considering prices in the mid-1900’s. However, it is important to keep in mind purchasing power – though the value of goods and services may have increased, it does not necessarily mean that the average household cannot afford the goods and services because the value of the dollar and their purchasing power also fluctuates.
Interestingly, adding the line, “All items less food and energy” gets rid of some of the volatility in the graph and gives us a cleaner look at the trend over the years. When reintroducing energy as a line, one can see the variation that is present (See Figure 2). However, the upward trend pattern over time is still present. This may be because energy prices tend to fluctuate more so than other items. Though food and beverages also adds more variation to the graph (See Figure 3), it does not seem to have as much volatility as energy.

Figure 2: CPI with energy as a line
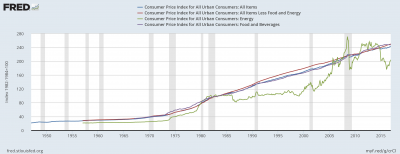
Figure 3: When introducing food and beverages as a line

The Prof: Log Scale
5 Comments
I think it is interesting to note that perhaps the period with the greatest growth in the CPI was the 1970’s, even before the OPEC debacle towards the end of the decade. This climb in prices occurred despite lackluster growth in energy prices. This poses a couple of questions. Either energy prices are insignificant in predicting inflation, or, oil was not nearly as diffused into the economy as it is now. I find the former hard to believe, based on the widespread necessity of petroleum to function in our daily lives. It is a crucial input towards producing a litany of common items (see my previous comment). Upon further research, it seems that plastic production exploded in the late sixties and seventies. Could this explain this phenomenon?
It seems to me that because energy, especially crude petroleum, is an important input for the production of plastic, the effect of plastic production and prices likely mirrors the effect of energy prices. It seems likelier that the sudden upturn in inflation starting in the 1970s was due to monetary policy aimed at full employment, which, as Karen talks about in her blog post, leads to higher inflation.
When considering the CPI, shouldn’t we consider the percentage change from a year ago as opposed to the index? As a proxy for inflation, I think the percentage change is much more important to analyze than looking at the overall steady increase in the CPI index.
As per Will, yes. Another way to do that is to use a log scale (I inserted the graph at the bottom of the post since you can’t do that in a comment). With a log scale, the same vertical increment represents the same percentage change. That way as well the slope is the rate of inflation. Without a log scale, if the CPI is at 1000 then a 2-point-monthly rise is trivial but gives a steep slope (2 clicks per month). In other words, with a non-log scale you can’t eyeball when inflation is higher or lower.
I wonder how the inclusion of energy will change CPI in the near-term future. Under the Obama administration we had tried to divert from fossil fuels but the first month of the Trump administration made it very clear that clean energy would not be on the table. All of the uncertainty surrounding the future of OPEC put the future of oil prices as a question that might be as good as anyone’s guesses. If other countries continue to invest in clean energy while we refuse to adapt, our dependency will almost certainly lead to another oil crisis akin to the one in the 1970s.
Comments are closed.